Financial
Performance Analysis
Notice a tremendous positive change in your financial performance within 60 days of employing our revenue cycle management services.
What Gets Measured Gets Improved
Sypore’s services are built on a firm foundation of data-driven processes that are purpose engineered and supported by state-of-the-art technology platforms. We believe in data-driven decision-making so that our actions are based on objective insights.
We believe in this approach so strongly that we provide a financial performance analysis to our valued customers – free of charge – complete with the good, the bad, and the ugly, along with root causes for each. We know no other company in the industry that does this proactively, again, providing our customers with Freedom of Time and Financial Peace of Mind!
Financial
Performance Analysis
The purpose of this analysis is to provide feedback on:
Annual volume metrics
Claims level reimbursement metrics
Claims level billing efficiency (timeliness) metrics
Comparison of reimbursement to peer group (National database from MGMA)
Accounts Receivable (A/R) metrics in comparison with Best in Class Practices
Recommendations on Financial Performance Maximization opportunities
Executive Summary

Commentary
Provider Productivity is high in terms of the number of patient encounters per full-time equivalent (FTE) provider. Average encounters are about
769
per month.
Sypore believes it can help increase net collections by at least
20%
and reduce billing-related costs for the practice to less than 6% of net cash collections.
Reimbursement in terms of cash collected per claim (on average) is about
$134.
This is good but has ample room for improvement with a target of around $164 (22.4% improvement).
The labor cost of Revenue Cycle Management was not measured as data on staff-related costs or external billing service fees was not available. For this type of practice, the all-inclusive labor cost of revenue collection should be no more than
$10
per claim.
Accounts receivable management indicates ample opportunity for improvement as it appears that rejections and denials are not being worked consistently and aggressively. This is leaving approximately
$350,000
in possible reimbursements at risk of loss (the longer the A/R ages, the lower the probability of collecting 100% of its allowed value). This also increases the cost of capital due to a cash conversion cycle, which entails the utilization of resources that could be utilized elsewhere. Without reviewing the write-off policy and the historical amounts written off in the last fiscal year, it is not possible to accurately gauge the performance in this area.
Ready To Talk?
Learn how we transform the revenue cycle with solutions that streamline the patient experience, drive operational efficiency, and improve financial performance.

The Western States
- Colorado
- California
- Oregon
- Washington
- Hawaii

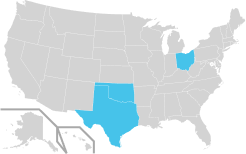
The Central States
- Texas
- Oklahoma
- Ohio

The Eastern States
- Alabama
- Delaware
- Florida
- Kentucky
- New York
- South Carolina
- North Carolina
- DC